Mumbai Following Singapore and New York in Popularity for 1BHKs
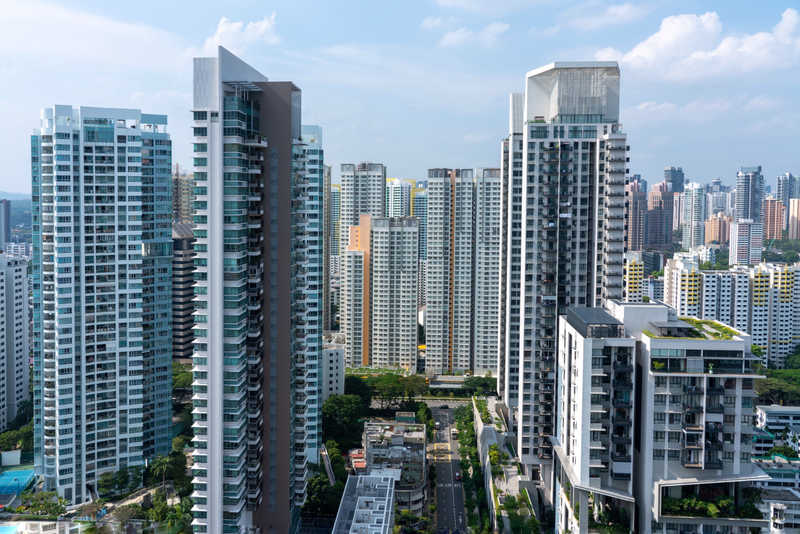
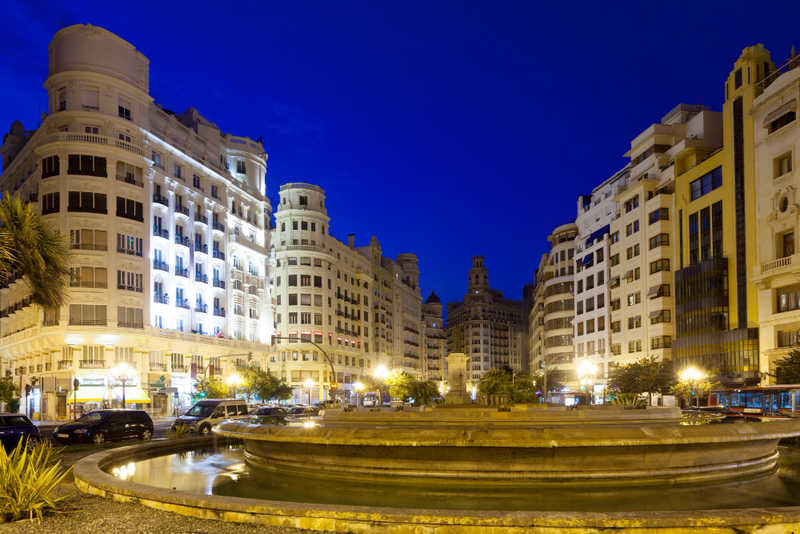
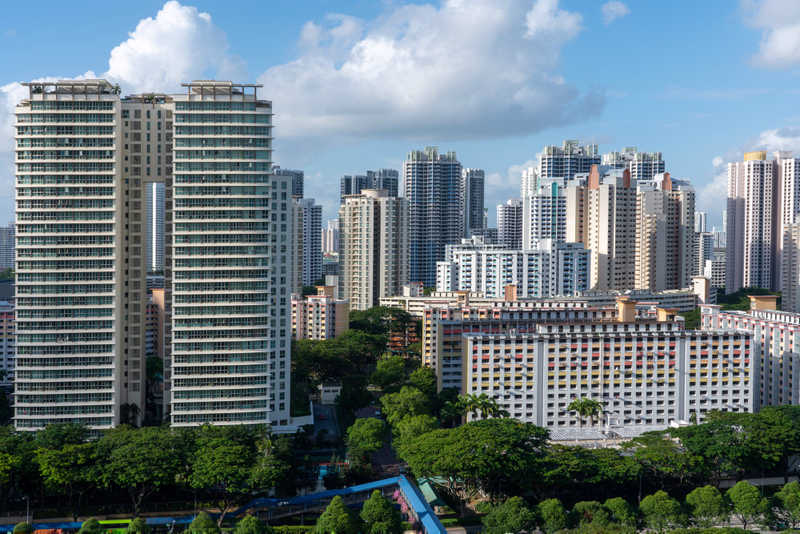
 According to latest data available from CommonFloor, it seems that Mumbai is now following suit with some of the most expensive cities in the world such as Singapore, New York and Hong Kong, where 1BHK are becoming more popular.
Highest number of 1BHKs in Mumbai
Mumbai currently ranks the 16th most expensive metro in the world rankings for residential housing, while it is the most expensive city in India, followed closely by Delhi. Property values in the most posh areas such as South Mumbai run anywhere between Rs 55,000-70,000 per sq. ft., while in the western suburbs, they are between Rs 35,000- 40,000 per sq. ft. In the eastern suburbs too, they are nothing less than Rs 15,000-25,000 per sq. ft. Capital values of apartments are proportionately high where a 2BHK costs approximately between Rs 80 lakh-1.5 crore and a 3BHK costs more than Rs 2 crore even in an ordinary suburb.
As such, the demand for 1BHK apartments in Mumbai has been on the rise. According to latest data from CommonFloor, Mumbai witnessed the most number of 1BHK units compared to other metros. In fact, about a whopping 35 per cent of residential units in Mumbai are 1BHK apartments followed by 12 per cent in Chennai, 7 per cent in NCR, 6 per cent in Bangalore and Chennai each and 2.5 per cent in Hyderabad.
While the city also witnessed a good number of 2BHK apartments (41.3 per cent), Hyderabad (46.9 per cent) and Bangalore (44.7 per cent) witnessed a higher number of available 2BHK units than Mumbai and other major metros. Kolkata and Bangalore scored higher in number of 3BHKs with Hyderabad and NCR following them closely. The following table gives a summary of the distribution of apartment units across six major cities.
|
BHK |
Bangalore |
Mumbai |
NCR |
Chennai |
Hyderabad |
Kolkata |
Grand Total |
|
1BHK |
5.82 |
34.92 |
6.71 |
12.00 |
2.31 |
5.98 |
13.68 |
|
2BHK |
44.67 |
41.3 |
28.18 |
46.22 |
46.92 |
37.49 |
41.24 |
|
3BHK |
41.52 |
18.03 |
40.27 |
37.36 |
41.02 |
43.41 |
35.06 |
|
4BHK |
7.23 |
4.81 |
21.37 |
3.87 |
8.68 |
11.76 |
8.76 |
|
5BHK |
0.76 |
0.93 |
3.48 |
0.55 |
1.08 |
1.35 |
1.26 |
|
Grand Total |
100.00 |
100.0 |
100.0 |
100.0 |
100.0 |
100.0 |
100.0 |
Table: Distribution of housing units across six major cities. All values in the table are in % (Source: CommonFloor data)


